Graph-structured data is widespread throughout the natural and social sciences, from quantum physics to finance. Building relational inductive reasoning into deep learning architectures is essential if we want systems that can learn, reason, and generalize from the data. Recent years have seen a rise in research on graph representation learning, which includes techniques for deep graph embeddings, generalizations of neural networks to graph-structured data, and neural message-passing approaches inspired by belief propagation. These advances in graph representation learning have led to new state-of-the-art results in numerous domains, including recommender systems, question answering, and social network analysis. The goal of this article is to provide an overview of graph representation learning by describing the characteristics and goals of graph representation learning, as well as fundamentals in methodological foundations in graph theory and network analysis.
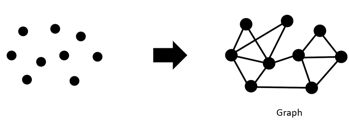
Graphs are data structures to describe relationships and interactions between entities in complex systems. In general, a graph contains a collection of entities called nodes and another collection of interactions between a pair of nodes called edges. Nodes represent entities, which can be of any object type that is relevant to our problem’s domain. By connecting nodes with edges, we will end up with a graph (network) of nodes. In addition, every node and edge may have attributes (or features) that contain additional information about those instances.
Graphs are a general language for describing and analyzing entities with relations and interactions, with complex data being represented as a graph of relationships between objects. Such networks are a fundamental tool for modeling social, technological, and biological systems. However, for today’s purpose, we will be focusing on the computational, algorithmic, and modeling challenges specific to the analysis of massive graphs. By means of studying the underlying graph structure and its features, a reader will be introduced to machine learning techniques and relevant tools to reveal insights on a variety of networks.
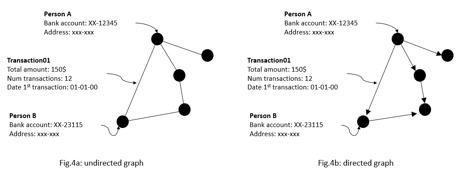
For example, if we would like to know how clients of a bank are related to each other based on their money transactions, then we can model this as a network of clients that transfer money to each other across the entire client data set. In this network, each node would be a client, and an edge between two clients represents that those two have once transfer money to each other. A node’s attributes could be bank account numbers and date of birth, while edge attributes could be the total amount of money, the number of transactions, and date of the first transaction.
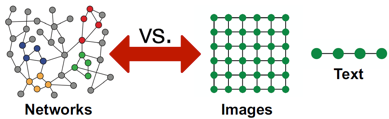
Sometimes the distinction between networks and graphs is blurred. The words networks and graphs are often used interchangeably, with the former being used more often in concrete applications and a the latter being often viewed as the abstract representation of the network. When one uses network, its normally in concrete settings: a computer network, a network of friends, social network, social networking sites. Whereas graphs probably invoke unfortunate memories of algebra.
To recap, a graph is made up of vertices connected by edges, while a network is made up of nodes connected by links. In fact, the concepts of network, trees and graphs are very important in computer science and the branch of mathematics that studies those concepts is called graph theory.
Graph terminology is more often used in situations where you want the edges/links to represent other types of relationships between the vertices/nodes. An example that has gotten some attention recently is the “interest graph”
in which the vertices are people and topics, and each edge links a person to a topic that they are interested in. One might argue that a social network should really be called a graph, since we often think of it in terms of the relationships between people rather than the status updates and tweets that get sent between them. In practice, there’s no precise rule for deciding which terms to use, but luckily it isn’t too hard to keep up with both types of terminology
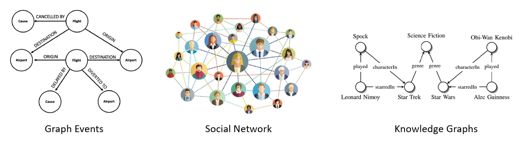
Networks are also known as natural graphs (social networks, communication, financial transactions, brain connections). These graphs are also known to show areas of representation (information, knowledge, similarity networks, relational structures). Similarity networks connect similar data points. Relational structures can represent molecules, particle physics, entities or parties.
How to Take Advantage of Relational Structure for Better Prediction?
Complex domains have a rich relational structure, which can be represented as a relational graph. By explicitly modeling relationships and augmenting feature space we achieve better performance.
So, why is it easier said than done?
Networks are complex because of several factors:
Graphs that don’t include the direction of an interaction between a node pair are called undirected graphs. The graph in example of Fig.3a is an undirected graph because according to the financial crime problem, there is an interest in finding out if clients are related to each other based on whether they have sent each other money or not. Since we’re not interested in who is the sender or beneficiary of the money the direction of the interaction is not relevant.
However, if there is an interest in who is the sender and beneficiary, then the direction of the money transfer is important. Graphs that include the direction of an interaction between a pair of nodes are called directed graphs, normally visualized by placing arrows on the edges of the graph.
In Fig.4a, we could also model the network as a directed graph. In that case, an arrow that goes from node entity A to entity B, means that money has been transferred between the two entities. Therefore, Fig 4b represents a money transaction relationship where entity A is the sender and entity B the beneficiary.
Another way to differentiate between graphs is by looking at types of nodes in the graph. A homogenous graph is when all of its nodes have same type. Fig.4a and Fig.4b are both examples of homogenous graphs because all nodes represent the same type, in this case it’s ‘person’. In reality, not all clients of the bank are normally persons, but it can also be companies. In that scenario, the graph would include another type of node that represents ‘companies,’ having their own set of node features such as type of company and date of establishment. A graph that has more than one node type is called heterogeneous graphs.
Moreover, there are also graphs with different types of edges called multi-relational. This means that in the network there are multiple ways that nodes can interact with each other.
In many use cases, edges in heterogeneous graphs are constrained by the different types of nodes it connects. Because some interaction can only occur between two specific node types, such as inFig.5, illustrates a network where the money is being transferred between companies and persons. This graph contains both edge directions and heterogeneous nodes.

The core feature in graph creation is understanding what business problem it is tries to solve. This will determine whether edges in the graph should have directions and whether it is homogeneous or heterogeneous. It’s essential, since we might get different results by running graph algorithms to estimate miscellaneous properties on undirected versus directed graphs. For instance, when running a network algorithm on an undirected payment transaction network model, we then assume that the money being transferred will go both ways. However, this is highly unlikely.
Traditional machine learning methods within different paradigms are a central approach to solve various types of problems, which is done by learning from batch historical data to find patterns and predict future events in classification or regression manner. If the goal is to predict a target variable value based on given labeled data, then it is supervised paradigm. If the goal is to identify patterns in the data, cluster analysis is often a popular unsupervised paradigm approach.
Machine learning with graphs integrates the line between these two paradigms due to two key variations in approaching the problem, in order to allow machines to learn with graphs from connections between data points.
Node embeddings is a task of aggregating information of a node’s position in the graph and its local neighbors. The result of aggregation process outputs encoded feature vector, called node embedding, that sums up the properties and characteristics of a node and all its relationships with local neighbor nodes. Embedding a nodes in many cases the first step towards implementing a machine learning model with graphs.
Typically, the resulting node embedding will be passed into another machine learning model during the training phase as an additional or sometimes enriched feature. The very process of node embedding serves as a function to augment the feature space. The intuition behind that is adding the node embedding will improve the model performance of that machine learning model, since it contains underlying structural information about the data points that were not captured with the initial feature set of the model.


Link prediction is one of the most important research topics in the field of graphs and networks. The objective of link prediction is to identify pairs of nodes that will either form a link or not in the future. Link prediction has various uses in real-world applications, with the below being some of the important use cases:

The task of link prediction is to determine the probability of a link between two nodes in a graph. A well-known class of approaches to carry out this task is called heuristic methods. These methods calculate similarity scores between two nodes based on their heuristics (such as graph distance, common neighbors, or PageRank). Heuristic methods basically reveal graph, node and edge properties at a point in time, which we can calculate directly from the graph to obtain the similarity score for each node pair. After that, we then sort the node pairs based on their similarity score and we predict that an edge should exist between the highest-scoring node pairs. Finally, we evaluate our predictions by checking if a non-existence edge in our initial time frame becomes present at a later point in time.
A drawback of heuristic methods is that it assumes when two nodes have common neighbors that they are more likely to connect. This might be the case when the graph represents a social network, such as the illegal wild-life trade in Fig.8.
The challenge here is to determine which heuristic method we should use to calculate the similarity score that makes the most sense for our use case. Recent studies show that we can actually learn how this heuristic method should look to optimize our link prediction. The idea is that we take each edge and enclose the nodes, which generates an embedding for those same nodes. Then we pass those two node embeddings into a function that concatenate (or sum, avg, distance etc.) them into a new feature vector and pass that to a downstream binary classifier, as shown in see Fig.9.

The focus of graph analytics is on the exploration and investigation of relationships between data points (entities, parties, institutions) in the dataset. Representing data structures as graphs allows us to discover concealed relationships and hidden patterns which could be easily ignored in traditional approaches, due to modelling around data as isolated data points. Machine learning on graphs assist in encoding graph structures that can be exploited further by machine learning models and augment feature space for better predictive capabilities.